Chart Wizard - Points Chart Properties
Points charts are used to show the relationship between two variables.
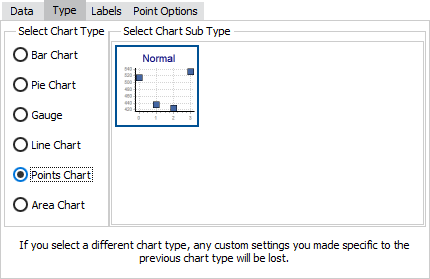
After you have selected a points chart from the list of chart types on the Type tab, you can then select a chart sub-type and configure various chart options.
Points Chart Sub-Types
The chart sub-type determines how the points for the selected series will appear. Points charts only have one sub-type for both classic and standard charts, called "Normal".

![]()
Point Options
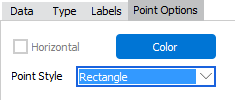
The Point Options tab provides some additional configuration options for points charts:

- Horizontal (disabled) - Not an available option for point charts.
- Color - Choose a color for the points in this series.
- Point Style - Classic charts only. Sets the shape of the points graphic (square, circle, triangle, etc.).
See also: Configuring Series Labels